It’s pretty clear that there are a lot of people who don’t like speed cameras. I’m one of them. But my objections are based on what I’ve observed by training drivers and riders. I think I know what makes people safe and what makes them dangerous. By and large, compliance with a posted speed limit does not come into either category. I’ve trained plenty of dangerous drivers who’d never exceed a limit and plenty of fine ones who would – happily.
So a great deal of speed camera policy stands or falls on the stats. And there lies a rather large problem. Here’s why…
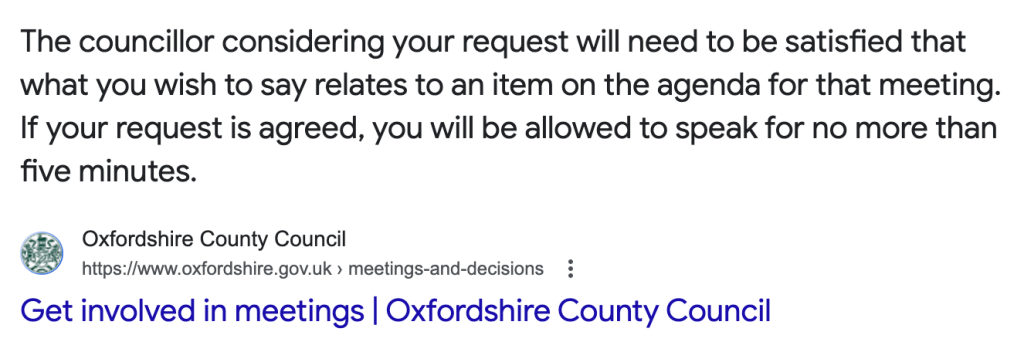
Try this little experiment. Go to your local speed camera partnership website and find their enquiry e-mail address. Ask them this question about one – just one – speed camera in your area:
“What were the causes of the crashes that led to you imposing this camera on the (insert road of your choice)”
I’d make a coffee if I were you, while you wait. It might be more sensible to plant a few beans and grow your own though – it’ll take a while. A very long while. And when you get an answer, don’t expect it to be enlightening.

I’ve had “don’t know”, “we don’t have the stats”, “ask the police” and a few other excuses. I’ve had figures that don’t even attempt to answer the question; simply listing the number of crashes not the causes.
It’s reassuring, then, that the Oxford Times has had just the same problem – but over even more basic and fundamental stats. The local Partnership were out, almost within minutes of the County Council pulling their funding, and claiming an 88% increase in speeds at one camera site and 18% at another only a few days after the cameras were switched off. The Oxford Times wanted to know what evidence they had to prove it. So they asked.
The reply?
“When The Oxford Times requested data for the Woodstock camera for 2008 and 2009 to make an equal comparison we were told those figures were not readily to hand.”
Not readily to hand, eh? How well I know that feeling. And this is from the very organisation that should know their figures so well they could recite them in their sleep.
The Oxford Times again:
“Now The Oxford Times has obtained the information it shows speed offences actually fell by four per cent at the Woodstock camera, close to Blenheim Palace, during five days of monitoring since the switch-off on August 1, compared to offences committed between 2008 and 2009.”
Clever, that. An 18% increase, when pressed, suddenly becomes a 4% decrease.
Camera partnerships have been accused of crying “wolf” rather too often. To me, this smells more like weasel.


Leave a comment